From editor:
Hearing the name ‘Jon Snow’ may bring Kit Harington’s face to the forefront of many people’s mind as an important character in ‘Game of Thrones’ but, for water treatment and public health professionals, there is another iconic ‘John Snow’ that may come to mind.
Dr. John Snow, an English physician born in 1813, contributed greatly to our understanding of anesthesia, epidemiology, public health, and – through the simple act of data mapping – changed the way we look at water supply systems, microorganisms, and infectious disease transmission.
Through an apprenticeship with a surgeon-apothecary in Newcastle, he witnessed the first cholera epidemic in 1831 which killed roughly 7,000 people and was believed at the time to be a disease transferred through “miasma”, a term used to describe bad or poisonous air. In 1843, Dr. Snow set up his own general practice in Soho and became interested in the physiology of respiration so, when the second great cholera epidemic hit in 1848, he began to question the theory that it was transferred through air. Since the symptoms were felt in the digestive tract, he suspected that cholera was the result of a “self-replicating agent” that was ingested most likely through water consumption; a theory officially published in 1849.
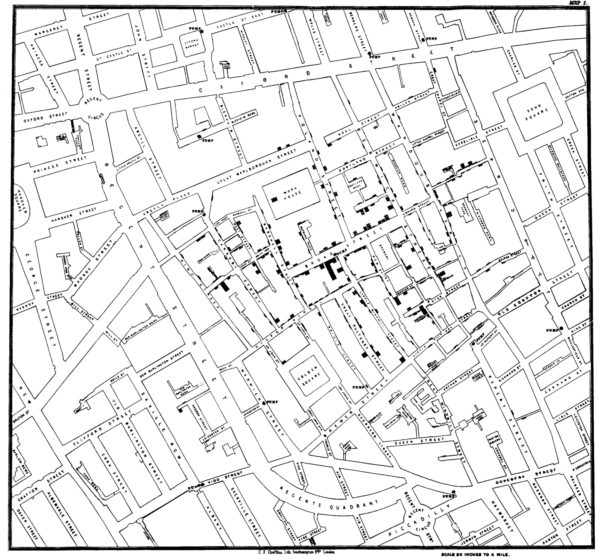
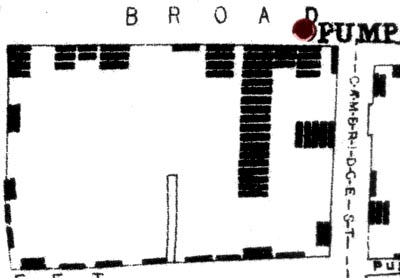
It wouldn’t be until 1854 when cholera returned, killing 550 people in his Soho neighborhood, that he could finally confirm his theory. By mapping the addresses and water sources of the cholera victims, Dr. Snow was able to identify a cluster of deaths and a common water pump on Broad Street that he suspected was responsible. He commissioned the council to remove the handle, and further investigation revealed a leaking underground sewage pipe that was contaminating the drinking water supply.
It wasn’t until much later, with Louis Pasteur’s germ theory in 1860, and Robert Koch’s work on anthrax and agar development in 1876, that the theory of microbial pathogens gained widespread acceptance. Koch’s team further refined the culture test method with staining techniques and, in 1883, it was discovered that the “self-replicating agent” that Snow suspected was in fact the pathogenic bacterium Vibrio cholerae.
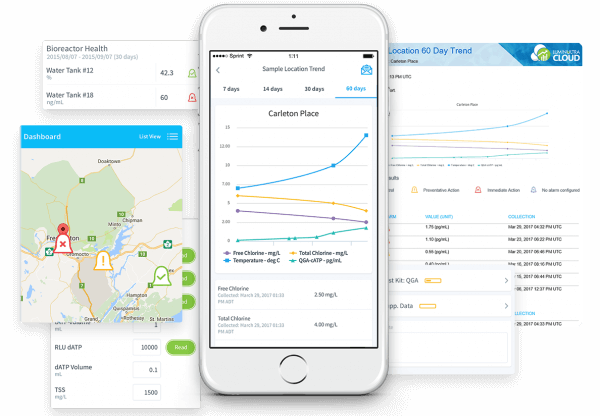
In today’s data-driven society, data visualization, like John Snow’s famous map, is a powerful way to analyze data. Plotting datasets on system maps and process diagrams can allow operators to quickly identify problem areas and pinpoint the source. To simplify your data management strategy, check out our new LuminUltra Cloud mobile app which will allow you to visualize your system’s data on city maps or process diagrams so you can see exactly where your challenges are, the magnitude of the problem, and determine what actions to take to quickly mitigate and resolve the issue.
Full Map:
Zoom in (source):
LuminUltra Cloud mobile app showcase:
Get LuminUltra Cloud here.


